Chapter 9 Workbook — Introduction to Calculus II: Accumulation and Change
Goal of this workbook:
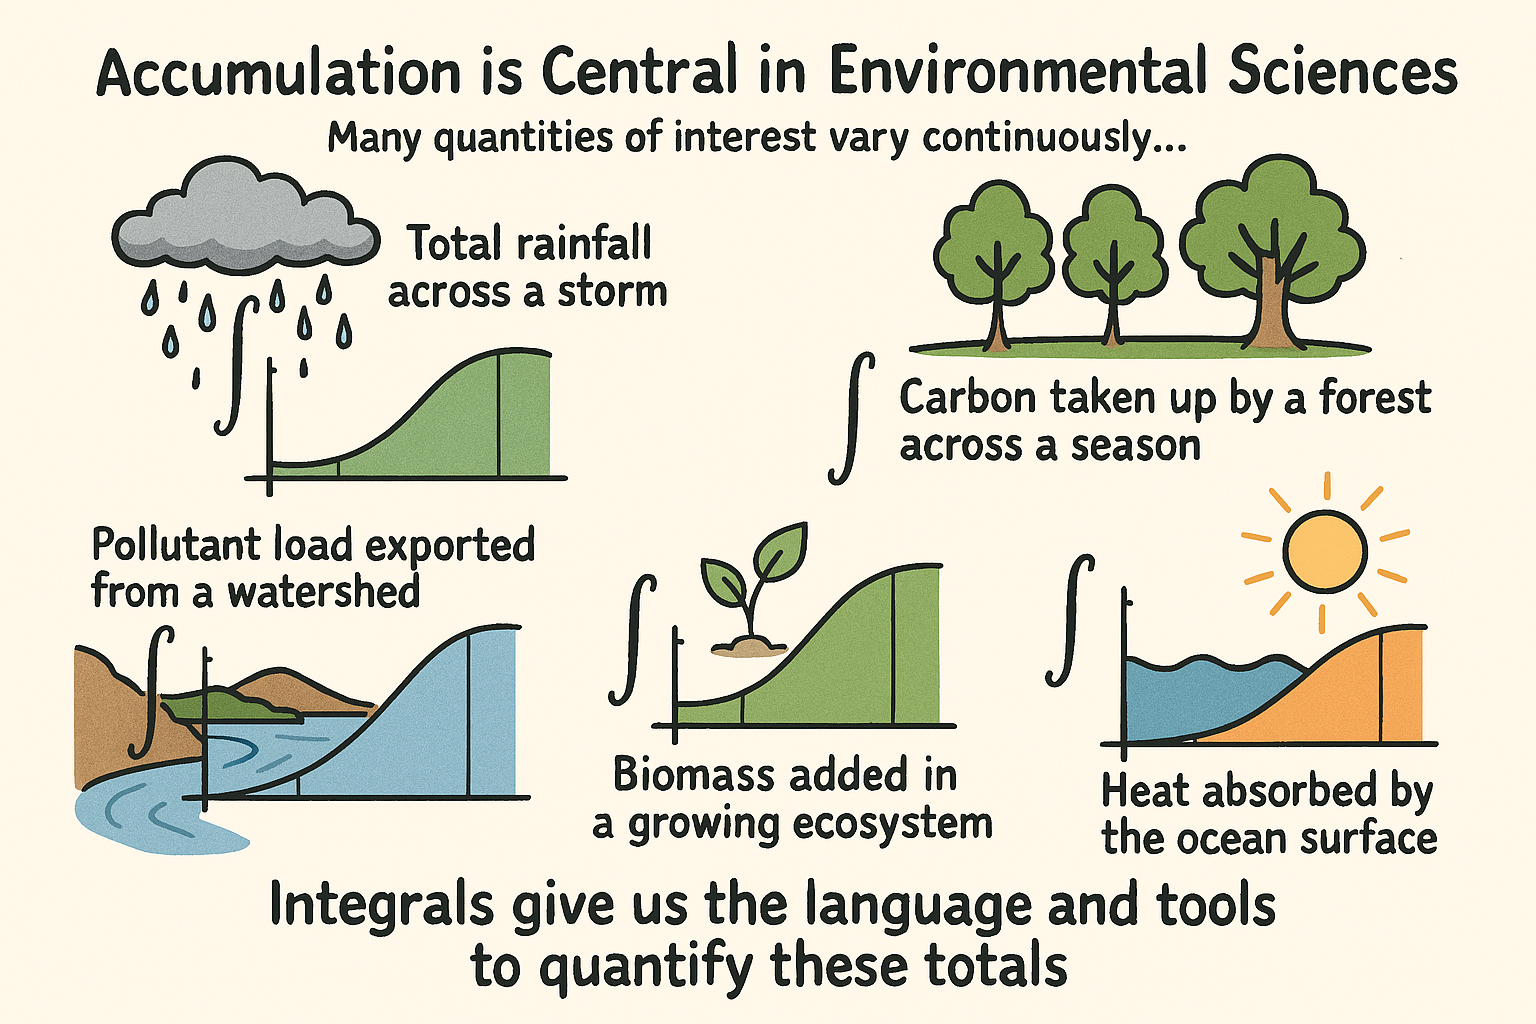
To help you build intuition for accumulation, connect rates to totals, and begin thinking like a modeler of natural systems.
You are not expected to compute integrals yet. Instead, you will reason, sketch, estimate, and explain.
9.1 Part 1 — From Instantaneous Change to Accumulated Change
9.2 Part 2 — Accumulation as “Adding Small Pieces”
9.2.1 Concept Check: Discrete Accumulation
Consider the 3-hour storm example from the chapter.
- Hour 1: 4 mm/hour
- Hour 2: 7 mm/hour
- Hour 3: 5 mm/hour
Prompt:
- What assumptions are we making about rainfall intensity within each hour?
- Why does adding the three hourly amounts give the correct total rainfall?
- What are the units of:
- rainfall rate?
- total rainfall?
- How much rainfall fell?
9.3 Part 3 — When Rates Vary Continuously
Individual Prompt: Reading a Graph
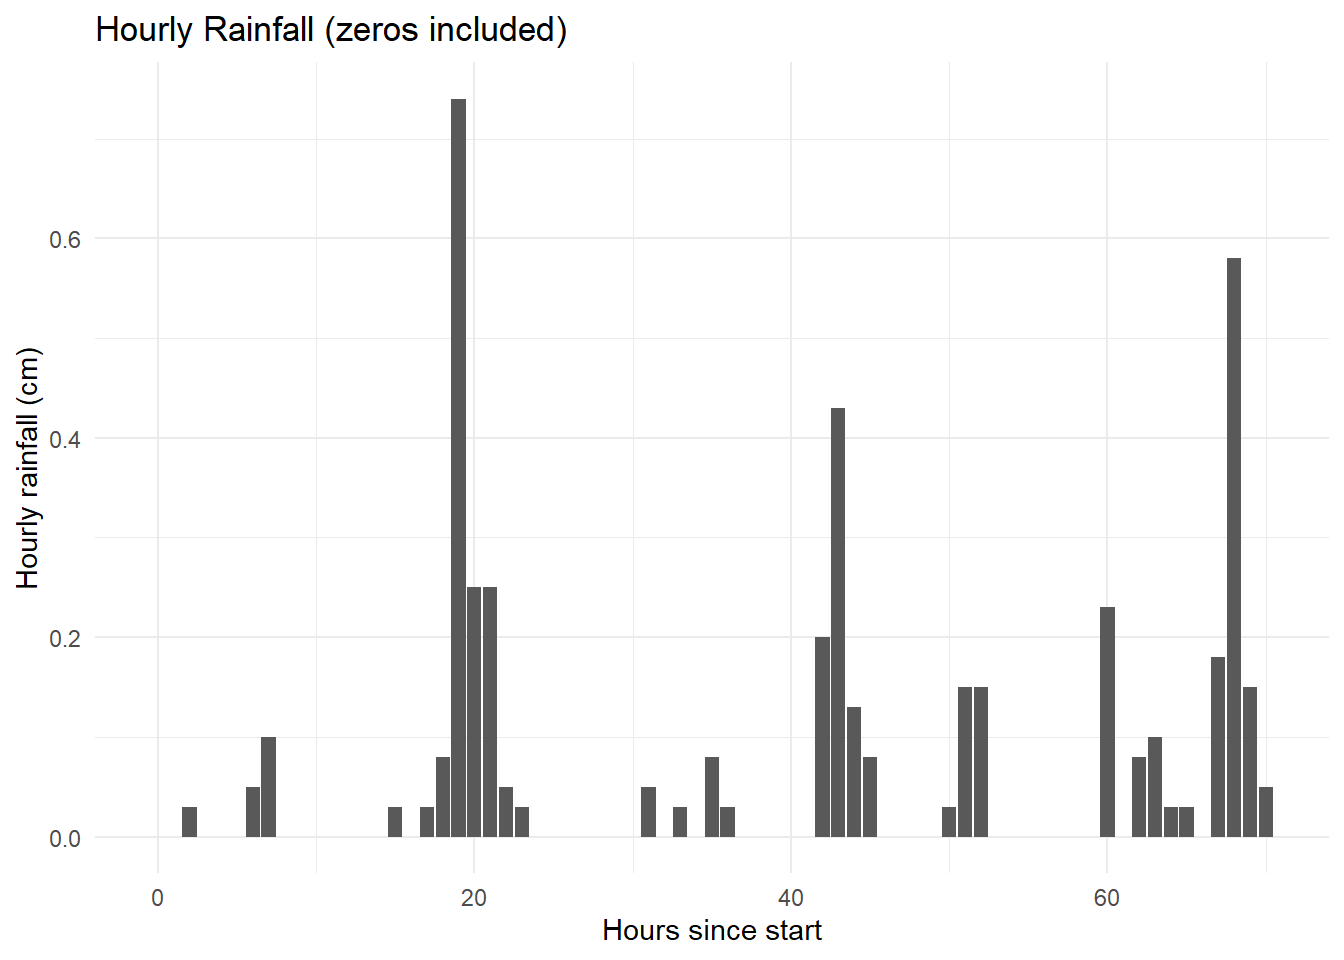
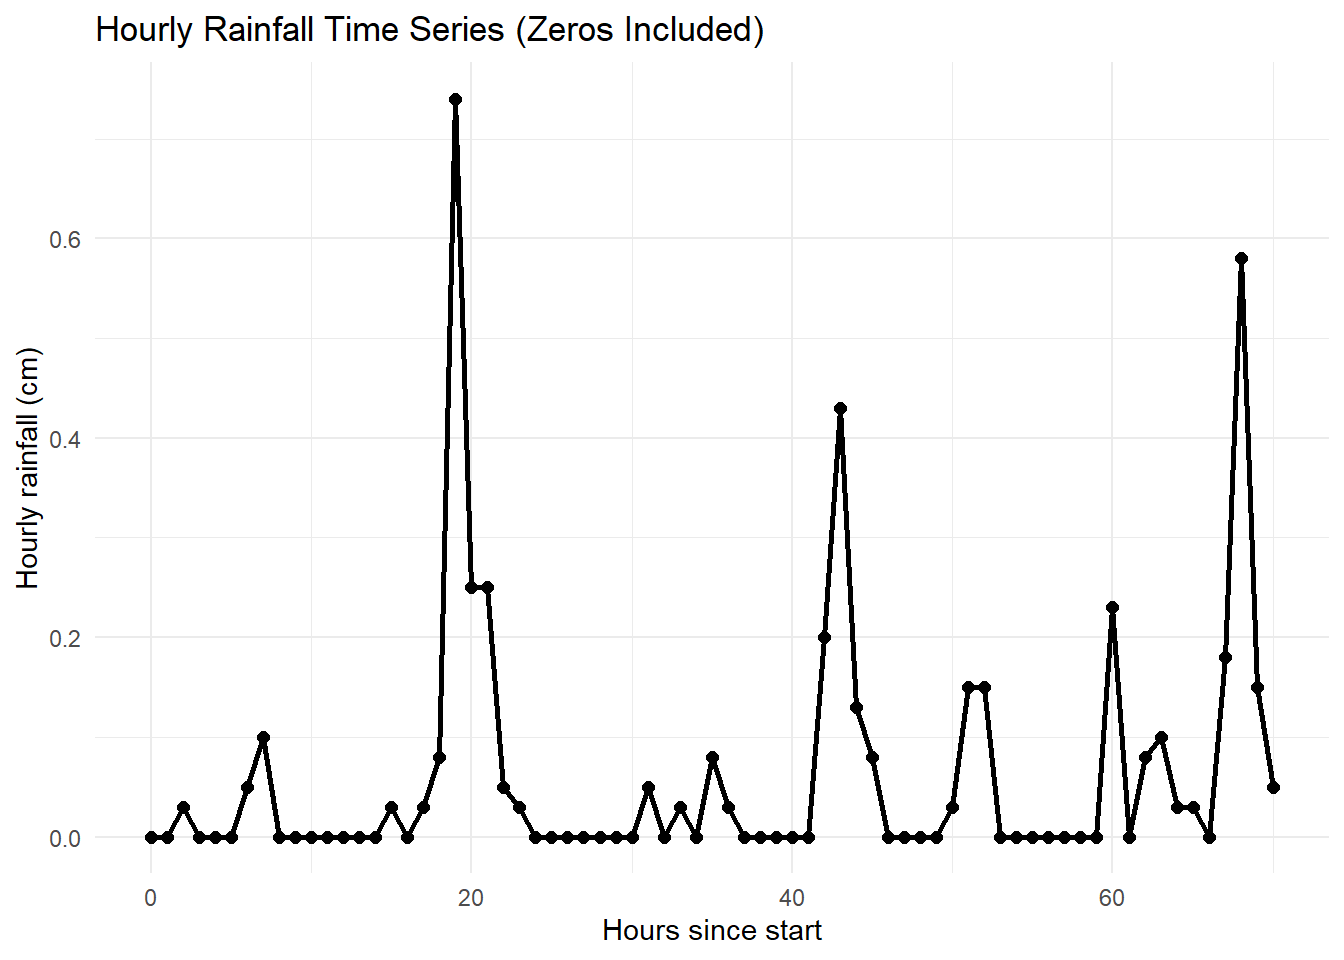
Look at the graphs of rainfall intensity that varies continuously over time.
Answer the following without doing any calculations:
- During which parts of the storm is rainfall accumulating fastest?
- During which parts is it accumulating slowest?
- Does the rainfall ever stop accumulating entirely? Why or why not?
- Which representation is more accurate?
9.4 Part 4 — Riemann Sums as an Idea (Not a Formula)
Imagine breaking the storm into:
- 3 rectangles
- 10 rectangles
- 100 rectangles
For each case:
- Would your estimate of total rainfall improve?
- What would become harder or more time-consuming?
- At what point does this process start to feel impractical?
9.5 Part 5 — Reversing Derivatives
9.5.1 Conceptual Prompt
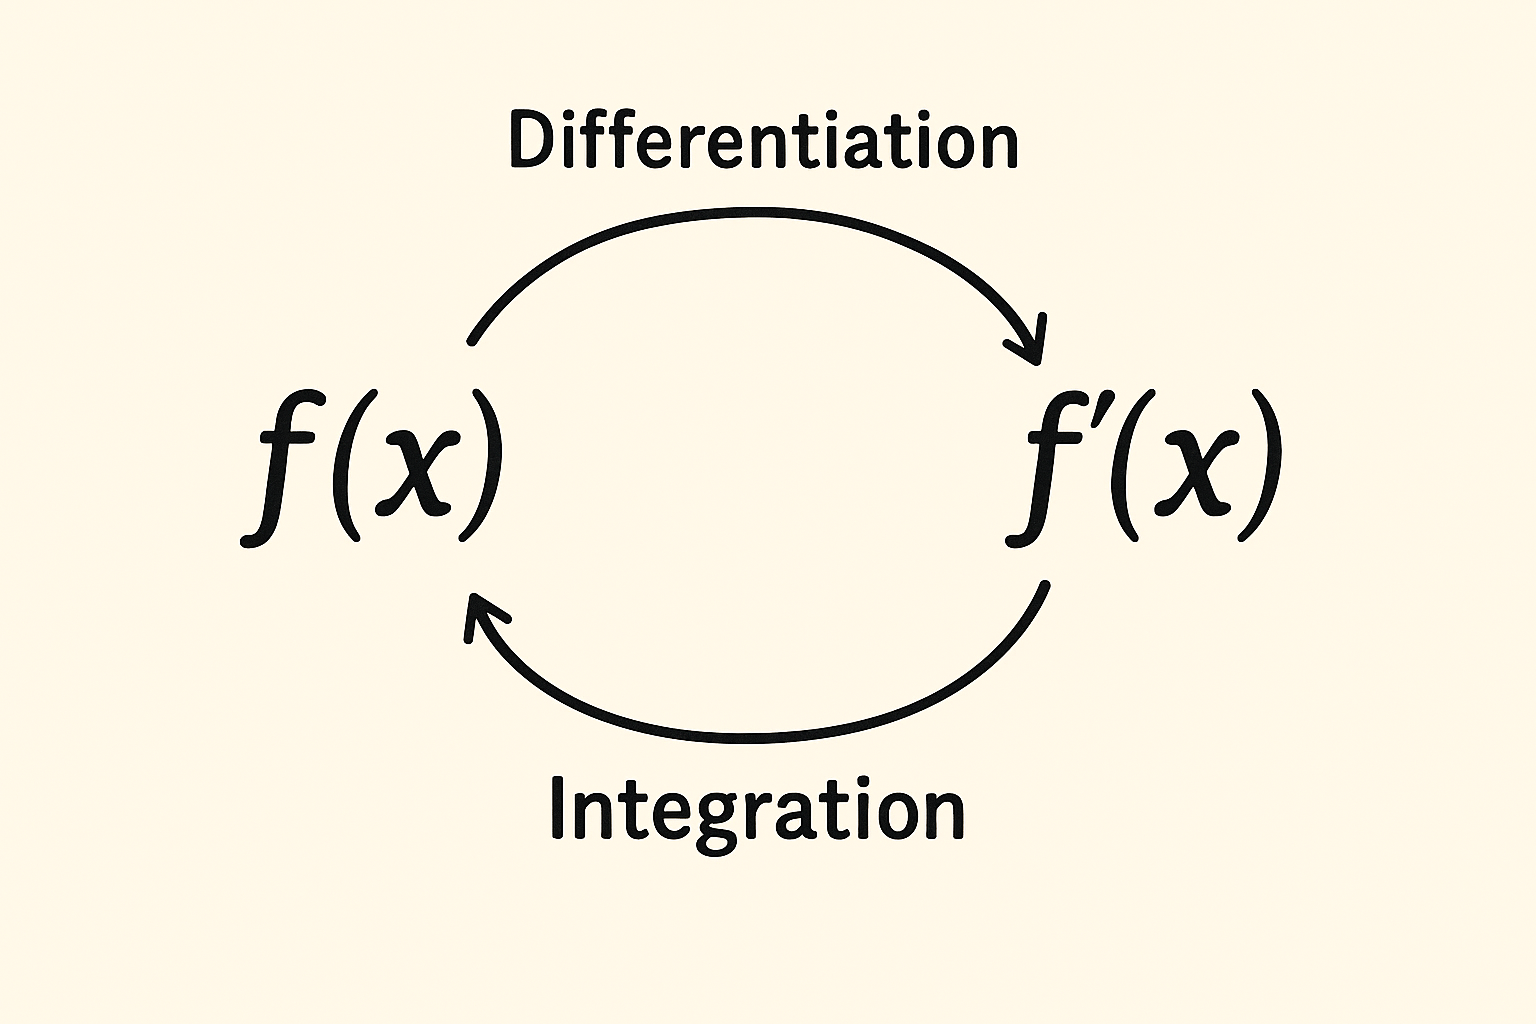
A derivative answers:
> “How fast is this changing right now?”
An integral answers:
> “How much has changed overall?”
Answer in your own words:
- What does it mean to “reverse” a derivative?
- Why might it be easier to measure or model a rate than a total?
- Give an environmental example where you would:
- measure a rate,
- but care about a total.